
ملف:Budget Deficit and Public Debt to GDP in 2012 (for selected EU Members).png

حجم هذه المعاينة: 800 × 600 بكسل. الأبعاد الأخرى: 320 × 240 بكسل | 640 × 480 بكسل | 960 × 720 بكسل.
الملف الأصلي (960 × 720 بكسل حجم الملف: 65 كيلوبايت، نوع MIME: image/png)
| هذا ملف من ويكيميديا كومنز. معلومات من صفحة وصفه مبينة في الأسفل. كومنز مستودع ملفات ميديا ذو رخصة حرة. |
.png)
ملخص
| الوصف |
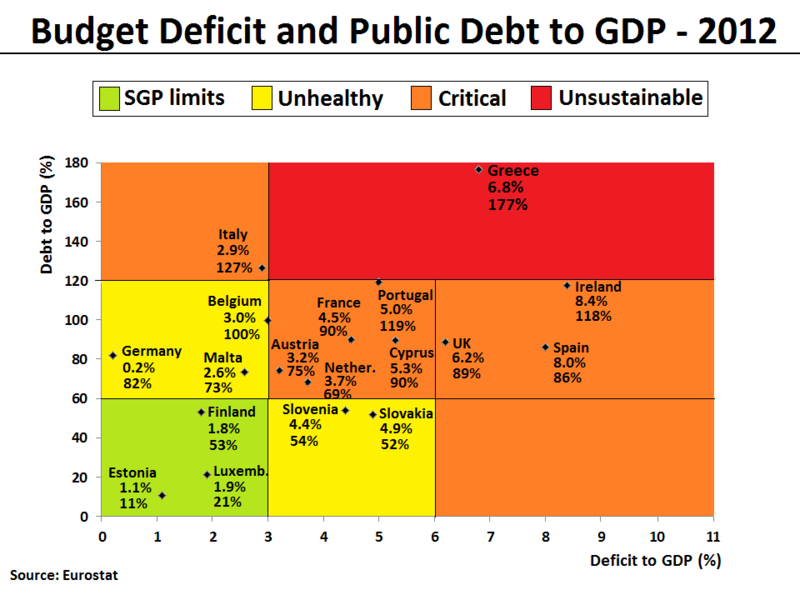
English: The Debt-to-GDP ratio and Budget deficit to GDP ratio have been plotted for all eurozone countries and UK in 2012. The same plot can also be found here with 2009 figures. The figures indicate the fiscal health of the countries in the plot. Generally, the farther up and to the right a country goes, the higher the risk for investors. The following 4 areas have been given a background color in the plot to reflect the level of fiscal health:
|
| التاريخ | |
| المصدر | عمل شخصي. Data for the chart is from the Eurostat database[1][2], which normally will be identical with the European Commision's AMECO database[3][4]. In the current version of the file, the figures are based on recorded data for the first 3 quarters and forecasted data for the last 4th quarter of 2012. The data can also be found published by the European Commission's latest Autumn Economic Forecast 2012 report. |
| المؤلف | Danish Expert |
| إصدارات أخرى | العربيَّة |
.png)
-ar.png)

|
هذه graph الصورة / الصورتان باستعمال رسومات متجهية ملفات رسوميات شعاعية.
It is recommended to name the SVG file "Budget Deficit and Public Debt to GDP in 2012 (for selected EU Members).svg" - then the template Vector version available (or Vva) does not need the new image name parameter.
|
ترخيص
أنا، صاحب حقوق التأليف والنشر لهذا العمل، أنشر هذا العمل تحت الرخصة التالية:
هذا الملفُّ مُرخَّص بموجب رخصة المشاع الإبداعي نسبة المُصنَّف إِلى مُؤَلِّفه - المشاركة بالمثل 3.0 العامة
- يحقُّ لك:
- مشاركة العمل – نسخ العمل وتوزيعه وبثُّه
- إعادة إنتاج العمل – تعديل العمل
- حسب الشروط التالية:
- نسب العمل إلى مُؤَلِّفه – يلزم نسب العمل إلى مُؤَلِّفه بشكل مناسب وتوفير رابط للرخصة وتحديد ما إذا أجريت تغييرات. بالإمكان القيام بذلك بأية طريقة معقولة، ولكن ليس بأية طريقة تشير إلى أن المرخِّص يوافقك على الاستعمال.
- الإلزام بترخيص المُشتقات بالمثل – إذا أعدت إنتاج المواد أو غيرت فيها، فيلزم أن تنشر مساهماتك المُشتقَّة عن الأصل تحت ترخيص الأصل نفسه أو تحت ترخيص مُتوافِقٍ معه.
تاريخ الملف
اضغط على زمن/تاريخ لرؤية الملف كما بدا في هذا الزمن.
| زمن/تاريخ | صورة مصغرة | الأبعاد | مستخدم | تعليق | |
|---|---|---|---|---|---|
| حالي | 17:47، 30 نوفمبر 2012 | | 960 × 720 (65 كيلوبايت) | Danish Expert | Data extended to cover all Eurozone countries and UK for comparison. |
| 12:52، 30 نوفمبر 2012 |  | 960 × 720 (55 كيلوبايت) | Danish Expert | Changed definition for the Unhealthy area, so that it now is more directly related to the official European SGP limits. Meaning that a country now needs to comply with 1 out of 2 fiscal SGP limits (and not exceed by far with the second), in order to be... | |
| 17:12، 29 نوفمبر 2012 |  | 960 × 720 (54 كيلوبايت) | Danish Expert | Color top-legend added. Y-axis stopped at 180 instead of 200, in order to improve layout with some more whitespace around the top-legend. | |
| 10:26، 29 نوفمبر 2012 |  | 960 × 720 (57 كيلوبايت) | Danish Expert | Clarified the concept of "unsustainable levels" by introducing a red color for this particular window, and leaving the orrange color only to map the area commonly referred to as "critical levels". | |
| 18:54، 25 نوفمبر 2012 |  | 960 × 720 (57 كيلوبايت) | Danish Expert | User created page with UploadWizard |
استخدام الملف
الصفحة التالية تستخدم هذا الملف:
الاستخدام العالمي للملف
الويكيات الأخرى التالية تستخدم هذا الملف:
- الاستخدام في en.wikipedia.org
- الاستخدام في ja.wikipedia.org
- الاستخدام في pt.wikipedia.org
.png)