
ملف:Climatic zones and antipodes.png
Climatic_zones_and_antipodes.png (180 × 180 بكسل حجم الملف: 31 كيلوبايت، نوع MIME: image/png)
| هذا ملف من ويكيميديا كومنز. معلومات من صفحة وصفه مبينة في الأسفل. كومنز مستودع ملفات ميديا ذو رخصة حرة. |
ملخص
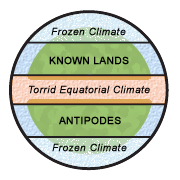
Diagram illustrating the classical climatic zones. The torrid (and "unhabitable") climatic zone of the equator is in red, the cold (and "unhabitable") climatic zones at the poles are in white/blue.
"Dating back to classical times, most people thought of the world as divided into zones of climate: a frozen climate at the poles, a torrid climate at the equator, and a blissfully mild (and therefore habitable) climate in between. They logically connected the temperature difference of these zones with proximity to the sun, and to a large extent they were right. Where they were wrong, however, was in their belief that the cold and torrid zones were impassable." [1] نسخة مؤرشفة at the Wayback Machine
This image was made by Leinad-Z. Based on Image:Mappaemundi vertical.gif by John Hamer and inspired by images from Macrobius' Commentarii in Somnium Scipionis. More specifically, the picture is related with the two diagrams below.
-
 The five climatic zones of the earth.
 -
 Figure of the Earth from Macrobius.


ترخيص
- يحقُّ لك:
- مشاركة العمل – نسخ العمل وتوزيعه وبثُّه
- إعادة إنتاج العمل – تعديل العمل
- حسب الشروط التالية:
- نسب العمل إلى مُؤَلِّفه – يلزم نسب العمل إلى مُؤَلِّفه بشكل مناسب وتوفير رابط للرخصة وتحديد ما إذا أجريت تغييرات. بالإمكان القيام بذلك بأية طريقة معقولة، ولكن ليس بأية طريقة تشير إلى أن المرخِّص يوافقك على الاستعمال.

|
هذه geology الصورة / الصورتان باستعمال رسومات متجهية ملفات رسوميات شعاعية.
It is recommended to name the SVG file "Climatic zones and antipodes.svg" - then the template Vector version available (or Vva) does not need the new image name parameter.
|
تاريخ الملف
اضغط على زمن/تاريخ لرؤية الملف كما بدا في هذا الزمن.
| زمن/تاريخ | صورة مصغرة | الأبعاد | مستخدم | تعليق | |
|---|---|---|---|---|---|
| حالي | 21:25، 18 أغسطس 2006 | | 180 × 180 (31 كيلوبايت) | Leinad-Z~commonswiki | "Texturized" version. |
| 21:23، 18 أغسطس 2006 |  | 180 × 180 (12 كيلوبايت) | Leinad-Z~commonswiki | New colors and text position. | |
| 19:44، 17 أغسطس 2006 |  | 180 × 180 (12 كيلوبايت) | Leinad-Z~commonswiki | Made by by Leinad-Z. Based on Image:Mappaemundi vertical.gif by John Hamer. |
استخدام الملف
الصفحة التالية تستخدم هذا الملف:
الاستخدام العالمي للملف
الويكيات الأخرى التالية تستخدم هذا الملف:
- الاستخدام في en.wikipedia.org
- الاستخدام في es.wikipedia.org
- الاستخدام في hu.wikipedia.org
- الاستخدام في no.wikipedia.org