
ملف:Greenland ice sheet temperatures Vinther et al 2009.png

الملف الأصلي (2٬006 × 1٬129 بكسل حجم الملف: 472 كيلوبايت، نوع MIME: image/png)
| هذا ملف من ويكيميديا كومنز. معلومات من صفحة وصفه مبينة في الأسفل. كومنز مستودع ملفات ميديا ذو رخصة حرة. |

|
هذه graph الصورة / الصورتان باستعمال رسومات متجهية ملفات رسوميات شعاعية.
It is recommended to name the SVG file "Greenland ice sheet temperatures Vinther et al 2009.svg" - then the template Vector version available (or Vva) does not need the new image name parameter.
|
ملخص
| الوصف |
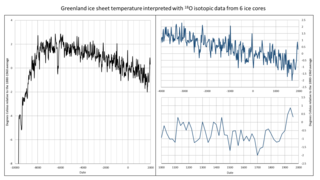
English: The temperature reconstruction produced using data from all six ice cores is shown by the black line in the attached figure, and spans the period from 9690BC to AD1970. The blue lines represent two focus on the dataset, first on the Late Holocene (or Meghalayan) and then on the last millenium. It has a resolution of around 20 years, meaning that each data point represents the average temperature of the surrounding 20 years. So, the end of the record – 1970 – shows the average temperature between 1960 and 1980.
The original data for the creation of these figures have been downloaded from the NOAA website: ftp://ftp.ncdc.noaa.gov/pub/data/paleo/icecore/greenland/vinther2009greenland.txt ORIGINAL REFERENCE: Vinther, B.M., S.L. Buchardt, H.B. Clausen, D. Dahl-Jensen, S.J. Johnsen, D.A. Fisher, R.M. Koerner, D. Raynaud, V. Lipenkov, K.K. Andersen, T. Blunier, S.O. Rasmussen, J.P. Steffensen, and A.M. Svensson. 2009. Holocene thinning of the Greenland ice sheet. Nature, Vol. 461, pp. 385-388, 17 September 2009. doi:10.1038/nature08355 SEE ALSO: Factcheck: What Greenland ice cores say about past and present climate change https://www.carbonbrief.org/factcheck-what-greenland-ice-cores-say-about-past-and-present-climate-change |
| التاريخ | |
| المصدر | عمل شخصي |
| المؤلف | Ambactos55 |
I made these figures to propose a correct version of the previous figure made by Artreve. His version used incorrectly the stated baseline (1880-1960 average) and missed the last centuries from the dataset.
ترخيص
- يحقُّ لك:
- مشاركة العمل – نسخ العمل وتوزيعه وبثُّه
- إعادة إنتاج العمل – تعديل العمل
- حسب الشروط التالية:
- نسب العمل إلى مُؤَلِّفه – يلزم نسب العمل إلى مُؤَلِّفه بشكل مناسب وتوفير رابط للرخصة وتحديد ما إذا أجريت تغييرات. بالإمكان القيام بذلك بأية طريقة معقولة، ولكن ليس بأية طريقة تشير إلى أن المرخِّص يوافقك على الاستعمال.
تاريخ الملف
اضغط على زمن/تاريخ لرؤية الملف كما بدا في هذا الزمن.
| زمن/تاريخ | صورة مصغرة | الأبعاد | مستخدم | تعليق | |
|---|---|---|---|---|---|
| حالي | 18:05، 23 يناير 2020 | | 2٬006 × 1٬129 (472 كيلوبايت) | Ambactos55 | Better frame and clipping. |
| 17:45، 23 يناير 2020 |  | 1٬937 × 1٬090 (268 كيلوبايت) | Ambactos55 | {{Information |description ={{en|1=The temperature reconstruction produced using data from all six ice cores is shown by the black line in the attached figure, and spans the period from 9690BC to AD1970. The blue lines represent two focus on the dataset, first on the Late Holocene (or Meghalayan) and then on the last millenium. It has a resolution of around 20 years, meaning that each data point represents the average temperature of the surrounding 20 years. So, the end of the record – 1970... |
استخدام الملف
الصفحة التالية تستخدم هذا الملف:
الاستخدام العالمي للملف
الويكيات الأخرى التالية تستخدم هذا الملف:
- الاستخدام في en.wikipedia.org
- الاستخدام في es.wikipedia.org
- الاستخدام في fr.wikipedia.org
- الاستخدام في ig.wikipedia.org
- الاستخدام في tr.wikipedia.org