انتقل إلى المحتوى

ملف:Ngrip bolling allerod do18 1.png

محتويات الصفحة غير مدعومة بلغات أخرى.
هذا ملف من ويكيميديا كومنز
من ويكيبيديا، الموسوعة الحرة

الملف الأصلي (1٬275 × 944 بكسل حجم الملف: 240 كيلوبايت، نوع MIME: image/png)

ملخص

الوصف
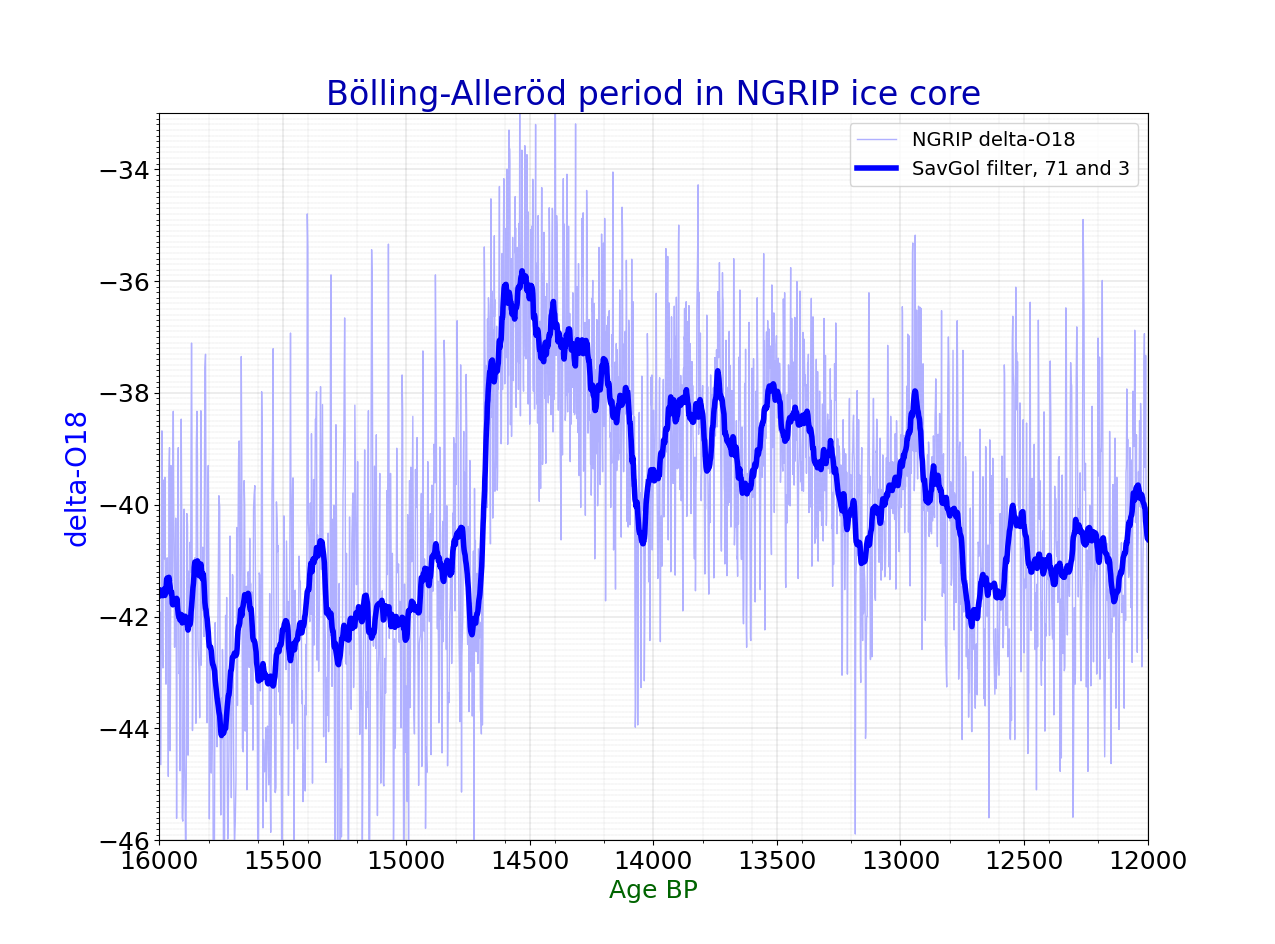
English: Bölling-Alleröd Greenland ice core NGRIP temperature data.


Data for this file is from http://www.iceandclimate.nbi.ku.dk/data/NGRIP_d18O_and_dust_5cm.xls http://www.iceandclimate.nbi.ku.dk/data/ processed to csv


δ18O values and dust concentrations


The dataset provides NGRIP δ18O values, dust concentrations, and GICC05 ages in 5cm depth resolution for the period 0-60 ka (δ18O) and 10-60 ka (dust).

The dataset accompany the following papers:

NGRIP members, Nature, 431, 147-151, 2004. DOI: 10.1038/nature02805

Gkinis et al., Earth Planet. Sci. Lett., 405, 132-141, 2014. DOI: 10.1016/j.epsl.2014.08.022

Ruth et al., J. Geophys. Res., 108, 4098, 2003. DOI: 4010.1029/2002JD002376

    1. drawing climate diagram in python 3
    2. version 2.11
    3. 11.9.2020


import matplotlib.pyplot as plt import numpy as np import pandas as pd from scipy import interpolate from matplotlib.ticker import (MultipleLocator, AutoMinorLocator) import scipy.signal

def running_mean(x, N):

   cumsum = np.cumsum(np.insert(x, 0, 0)) 
   return (cumsum[N:] - cumsum[:-N]) / float(N)


datafilename="ngrip1.csv" captioni="Bölling-Alleröd period in NGRIP ice core" savename="ngrip_dryas.svg"

figsizex=16 figsizey=8

  1. x = []
  2. y = []
  3. y2= []


dfin0=pd.read_csv(datafilename, sep=";")

lst1=['gicc05_age','delta_O18']

dfin1 = dfin0[dfin0.columns.intersection(lst1)]

x0=dfin1['gicc05_age'] y0=dfin1['delta_O18']

  1. y20=dfin1['GISP_dO18']
  2. y30=dfin1['GISP2_dO18']


x=np.array(x0) y=np.array(y0)


size0=14 size1=16 size2=18 size3=24


  1. y_savgol = scipy.signal.savgol_filter(y,31, 3)

y_savgol = scipy.signal.savgol_filter(y,71, 3)


  1. y_running = running_mean(y, 31)


x_sm = np.array(x) y_sm = np.array(y) x_smooth = np.linspace(x_sm.min(), x_sm.max(), 20000) funk1 = interpolate.interp1d(x_sm, y_sm, kind="cubic") y_smooth = funk1(x_smooth)


fig, ax1 = plt.subplots()


  1. ax1.axis((11600,14000,0,ymax1))

ax1.set_xlim(12000,16000) ax1.set_ylim(-33.0, -46.0)

  1. ax1.set_ylim(-35.0, -42.0)

plt.gca().invert_xaxis() plt.gca().invert_yaxis()

ax1.set_ylabel('delta-O18', color='#0000ff', fontsize=size2+2)


ax1.plot(x,y, color="#b0b0ff", linewidth=1,label="NGRIP delta-O18")

  1. ax1.plot(x_smooth,y_smooth, color="#0000ff", linewidth=3,label="NGRIP delta-O18")

ax1.plot(x,y_savgol, color="#0000FF", linewidth=4, label="SavGol filter, 71 and 3")

  1. ax1.plot(x,y_running, color="#FF0000", linewidth=3)


  1. ax1.plot(x,data_avg1, color="#ff0000", linewidth=2, linestyle=":", label="Average of NGRIP, GISP, GISP2 delta-O18")


ax1.tick_params(axis='both', which='major', labelsize=size2)

ax1.xaxis.set_minor_locator(MultipleLocator(1000)) ax1.xaxis.set_minor_locator(MultipleLocator(200))

ax1.yaxis.set_minor_locator(MultipleLocator(1.0)) ax1.yaxis.set_minor_locator(MultipleLocator(0.1))

ax1.grid(which='major', linestyle='-', linewidth='0.1', color='black') ax1.grid(which='minor', linestyle=':', linewidth='0.1', color='black')


ax1.set_xlabel('Age BP', color="darkgreen", fontsize=size2)


ax1.set_title(captioni, fontsize=size3, color="#0000af")

plt.legend(fontsize=size0)

fig = plt.gcf() fig.set_size_inches(figsizex, figsizey, forward=True)


plt.savefig(savename, format="svg", dpi = 100)

plt.show()


Old stuff:


The data is from oxygen isotope ratio delta-O18.

Source of oxygen isotope data is "North Greenland Ice Core Project Oxygen Isotope Data." IGBP PAGES/World Data Center for Paleoclimatology Data Contribution Series # 2004-059. NOAA/NGDC Paleoclimatology Program, Boulder CO, USA.

The original data file has processed with R and plotted with ggplot2, with the following code:

library(tidyverse)
library(readr)
# Loads the data, skipping the first 79 lines (comments)
ngrip_d18o_50yr <- read_table2("ftp://ftp.ncdc.noaa.gov/pub/data/paleo/icecore/greenland/summit/ngrip/isotopes/ngrip-d18o-50yr.txt", 
                               skip = 79)
# Filters the relevant time period, pipes into ggplot()
ngrip_d18o_50yr %>% filter(Age <= 16000 & Age >= 12000) %>% 
  # Creates the plot
  ggplot(aes(x=Age, y=d18O)) + geom_path(color="red") + scale_x_reverse() +
  labs(x="Age, ss09sea, years before 2000 AD", y="delta 18O, permille") + theme_bw()
التاريخ
المصدر عمل شخصي
المؤلف Merikanto, bender235

ترخيص

أنا، صاحب حقوق التأليف والنشر لهذا العمل، أنشر هذا العمل تحت الرخصة التالية:
w:ar:مشاع إبداعي
نسب العمل إلى مُؤَلِّفه الإلزام بترخيص المُشتقات بالمثل
يحقُّ لك:
  • مشاركة العمل – نسخ العمل وتوزيعه وبثُّه
  • إعادة إنتاج العمل – تعديل العمل
حسب الشروط التالية:
  • نسب العمل إلى مُؤَلِّفه – يلزم نسب العمل إلى مُؤَلِّفه بشكل مناسب وتوفير رابط للرخصة وتحديد ما إذا أجريت تغييرات. بالإمكان القيام بذلك بأية طريقة معقولة، ولكن ليس بأية طريقة تشير إلى أن المرخِّص يوافقك على الاستعمال.
  • الإلزام بترخيص المُشتقات بالمثل – إذا أعدت إنتاج المواد أو غيرت فيها، فيلزم أن تنشر مساهماتك المُشتقَّة عن الأصل تحت ترخيص الأصل نفسه أو تحت ترخيص مُتوافِقٍ معه.

الشروحات

أضف شرحاً من سطر واحد لما يُمثِّله هذا الملف
Bölling-Alleröd Greenland ice core NGRIP temperature data.

العناصر المصورة في هذا الملف

يُصوِّر

٣٠ ديسمبر 2018

تاريخ الملف

اضغط على زمن/تاريخ لرؤية الملف كما بدا في هذا الزمن.

زمن/تاريخصورة مصغرةالأبعادمستخدمتعليق
حالي18:17، 12 سبتمبر 2020تصغير للنسخة بتاريخ 18:17، 12 سبتمبر 20201٬275 × 944 (240 كيلوبايت)MerikantoNew data and layout
18:26، 30 ديسمبر 2018تصغير للنسخة بتاريخ 18:26، 30 ديسمبر 2018985 × 794 (11 كيلوبايت)Bender235created new version, using ggplot2
15:14، 30 نوفمبر 2015تصغير للنسخة بتاريخ 15:14، 30 نوفمبر 2015985 × 794 (65 كيلوبايت)MerikantoUser created page with UploadWizard

الصفحة التالية تستخدم هذا الملف:

الاستخدام العالمي للملف

الويكيات الأخرى التالية تستخدم هذا الملف:

بيانات وصفية